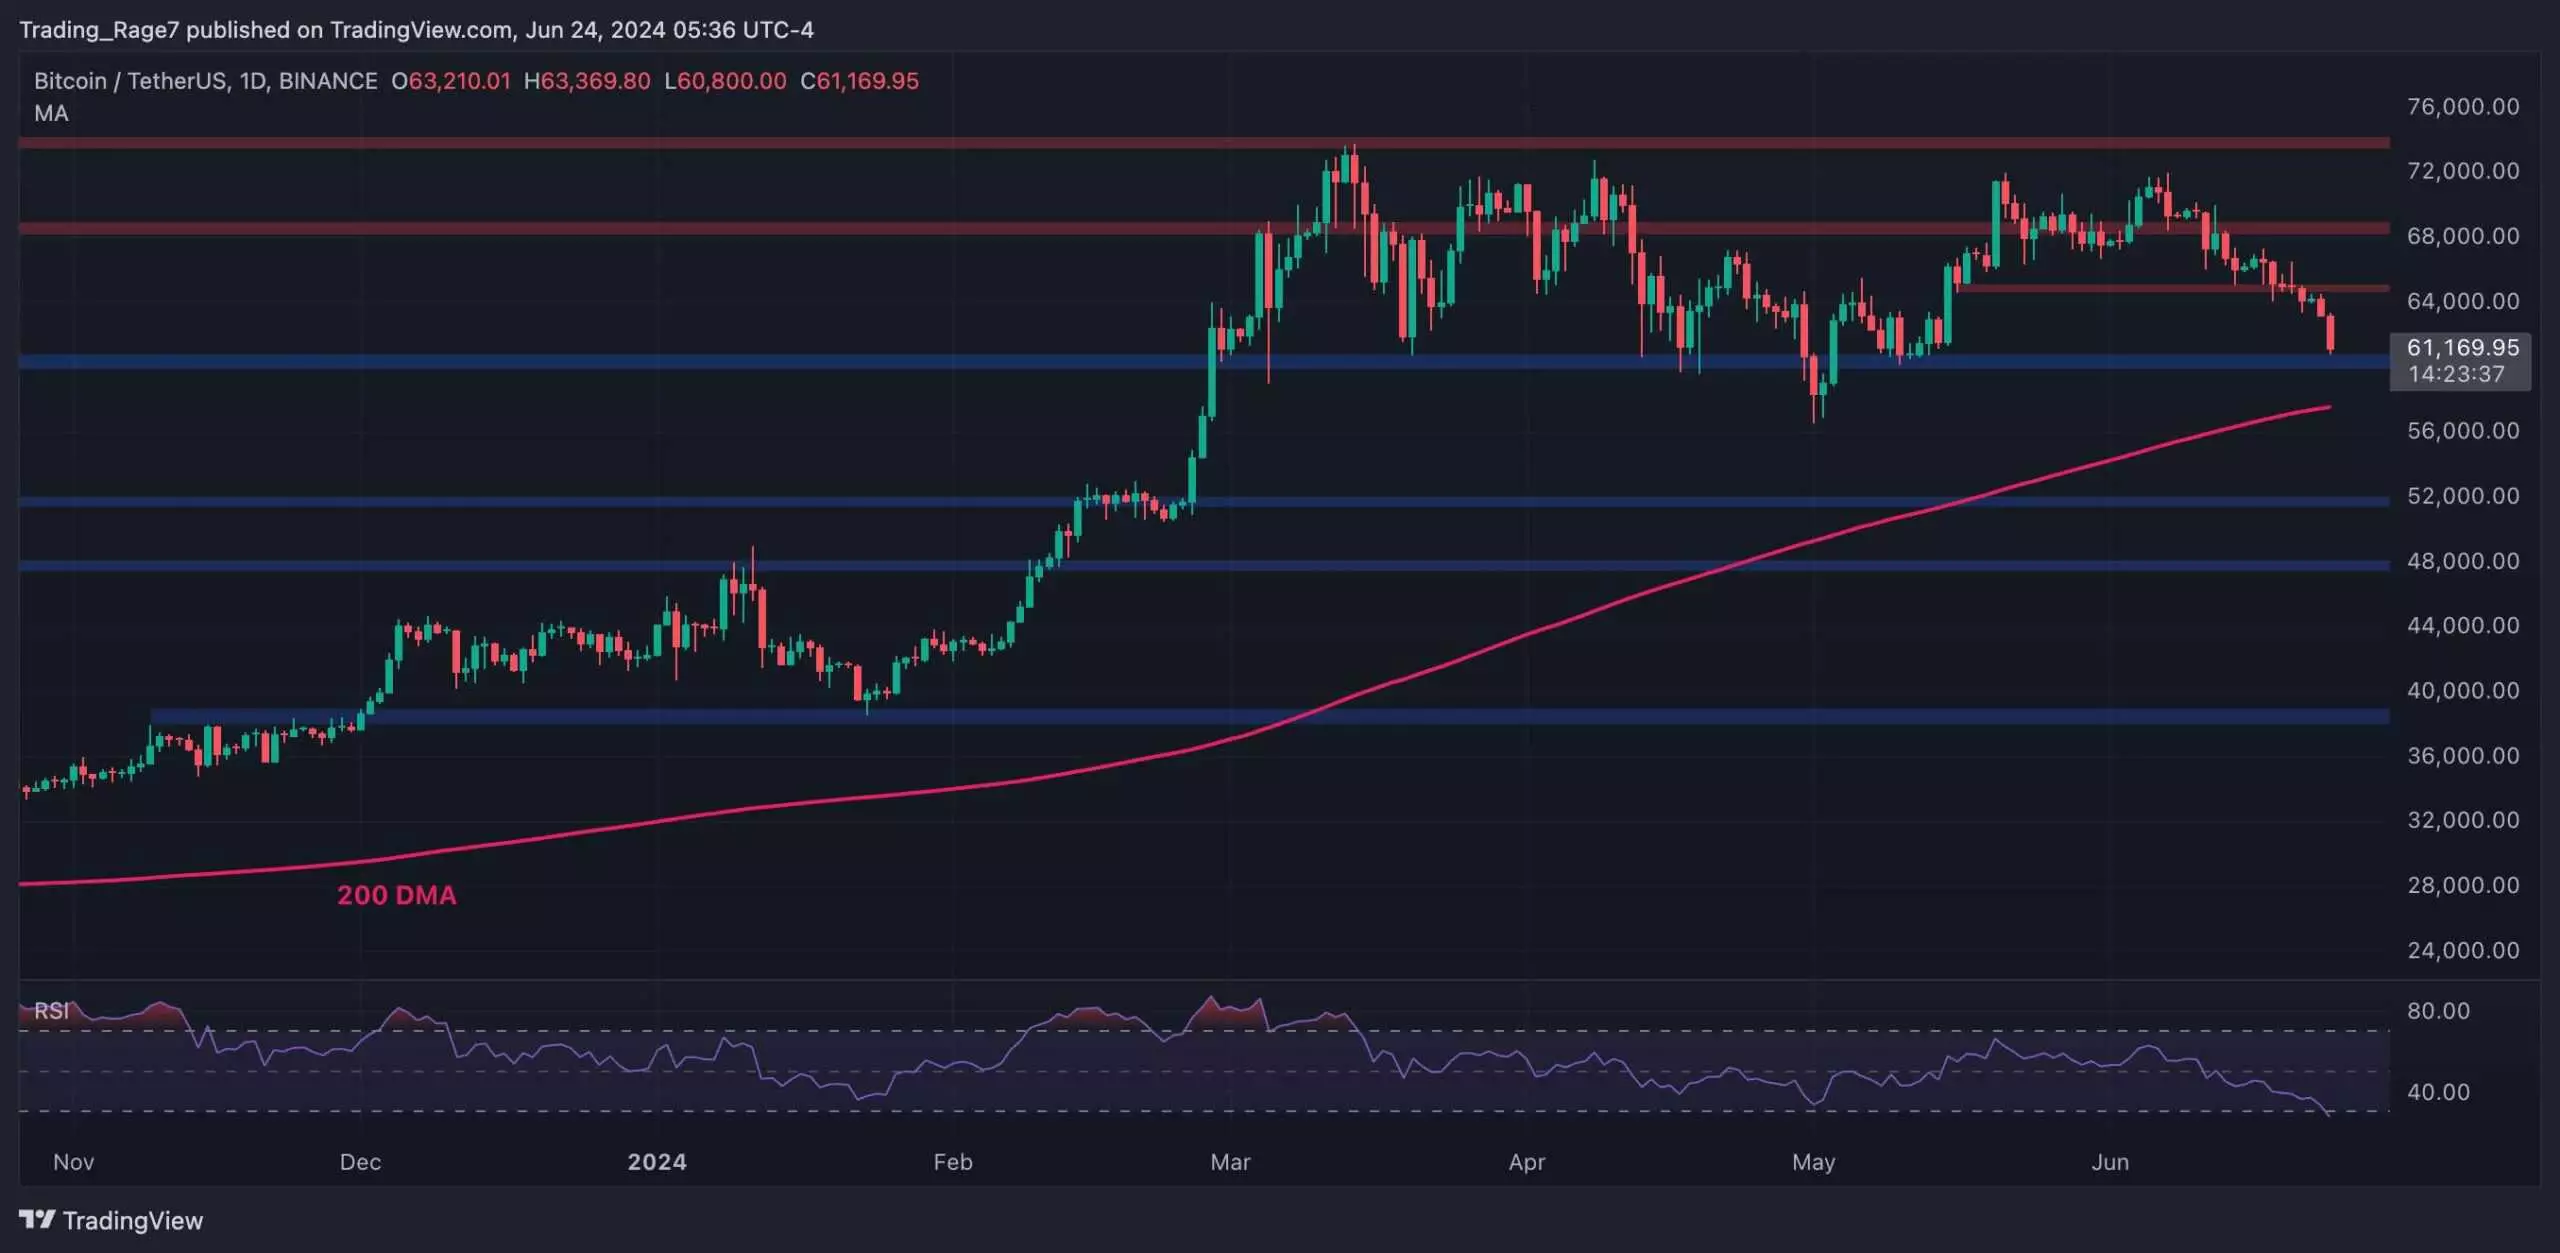
Bitcoin’s price has experienced a sharp decline in recent days after failing to maintain levels above $70K. The market is currently approaching a critical level, with the price now nearing the pivotal $60K support level. The 200-day moving average, which sits at around $58K, could be tested if the price breaks below $60K. The mid-term outlook of the market will heavily depend on how the price reacts to these key support levels.
Short-Term Indicators
On the 4-hour chart, a large falling wedge pattern has been broken to the downside, indicating a bearish trend. The Relative Strength Index (RSI) has also dropped significantly and is currently below 30%, suggesting that Bitcoin is oversold on this time frame. As a result, a short-term rebound or consolidation around the $60K level is likely. However, a further decline could target the $58K support zone if the market continues to move downwards.
Investor Sentiment
Despite the recent price drop in Bitcoin, many investors have seen their unrealized profits diminish. Some holders have opted to realize their profits and exit the market to avoid potential losses. The Short-Term Holder SOPR chart reflects the profit and loss ratio, with values above one indicating profitable selling and values below one signifying losses. The current trend in the STH SOPR mirrors that of the BTC price, suggesting that short-term holders are at risk of incurring losses if the market falls below $60K. However, it is worth noting that such lows are common during bull markets, indicating that a potential rebound may be on the horizon.
Overall, the recent price drop in Bitcoin has created uncertainty among investors, with key support levels at $60K and $58K now in focus. Technical indicators point towards a bearish trend in the short term, but the overall market sentiment remains optimistic, considering the historical behaviors of bull markets. Investors should closely monitor the price action and be prepared for potential volatility in the coming days.


Leave a Reply