The cryptocurrency market operates under a unique blend of volatility and investor sentiment, and Ripple (XRP) is no exception. Recent fluctuations in its price indicate a cautious stance among investors, with movements illustrating a juxtaposition between bearish pressures and attempts at recovery. As we delve into Ripple’s recent behavior, it is essential to analyze the prevailing trends and levels of significance that might dictate its future trajectory.
The Daily Chart Analysis: Resistance and Support Dynamics
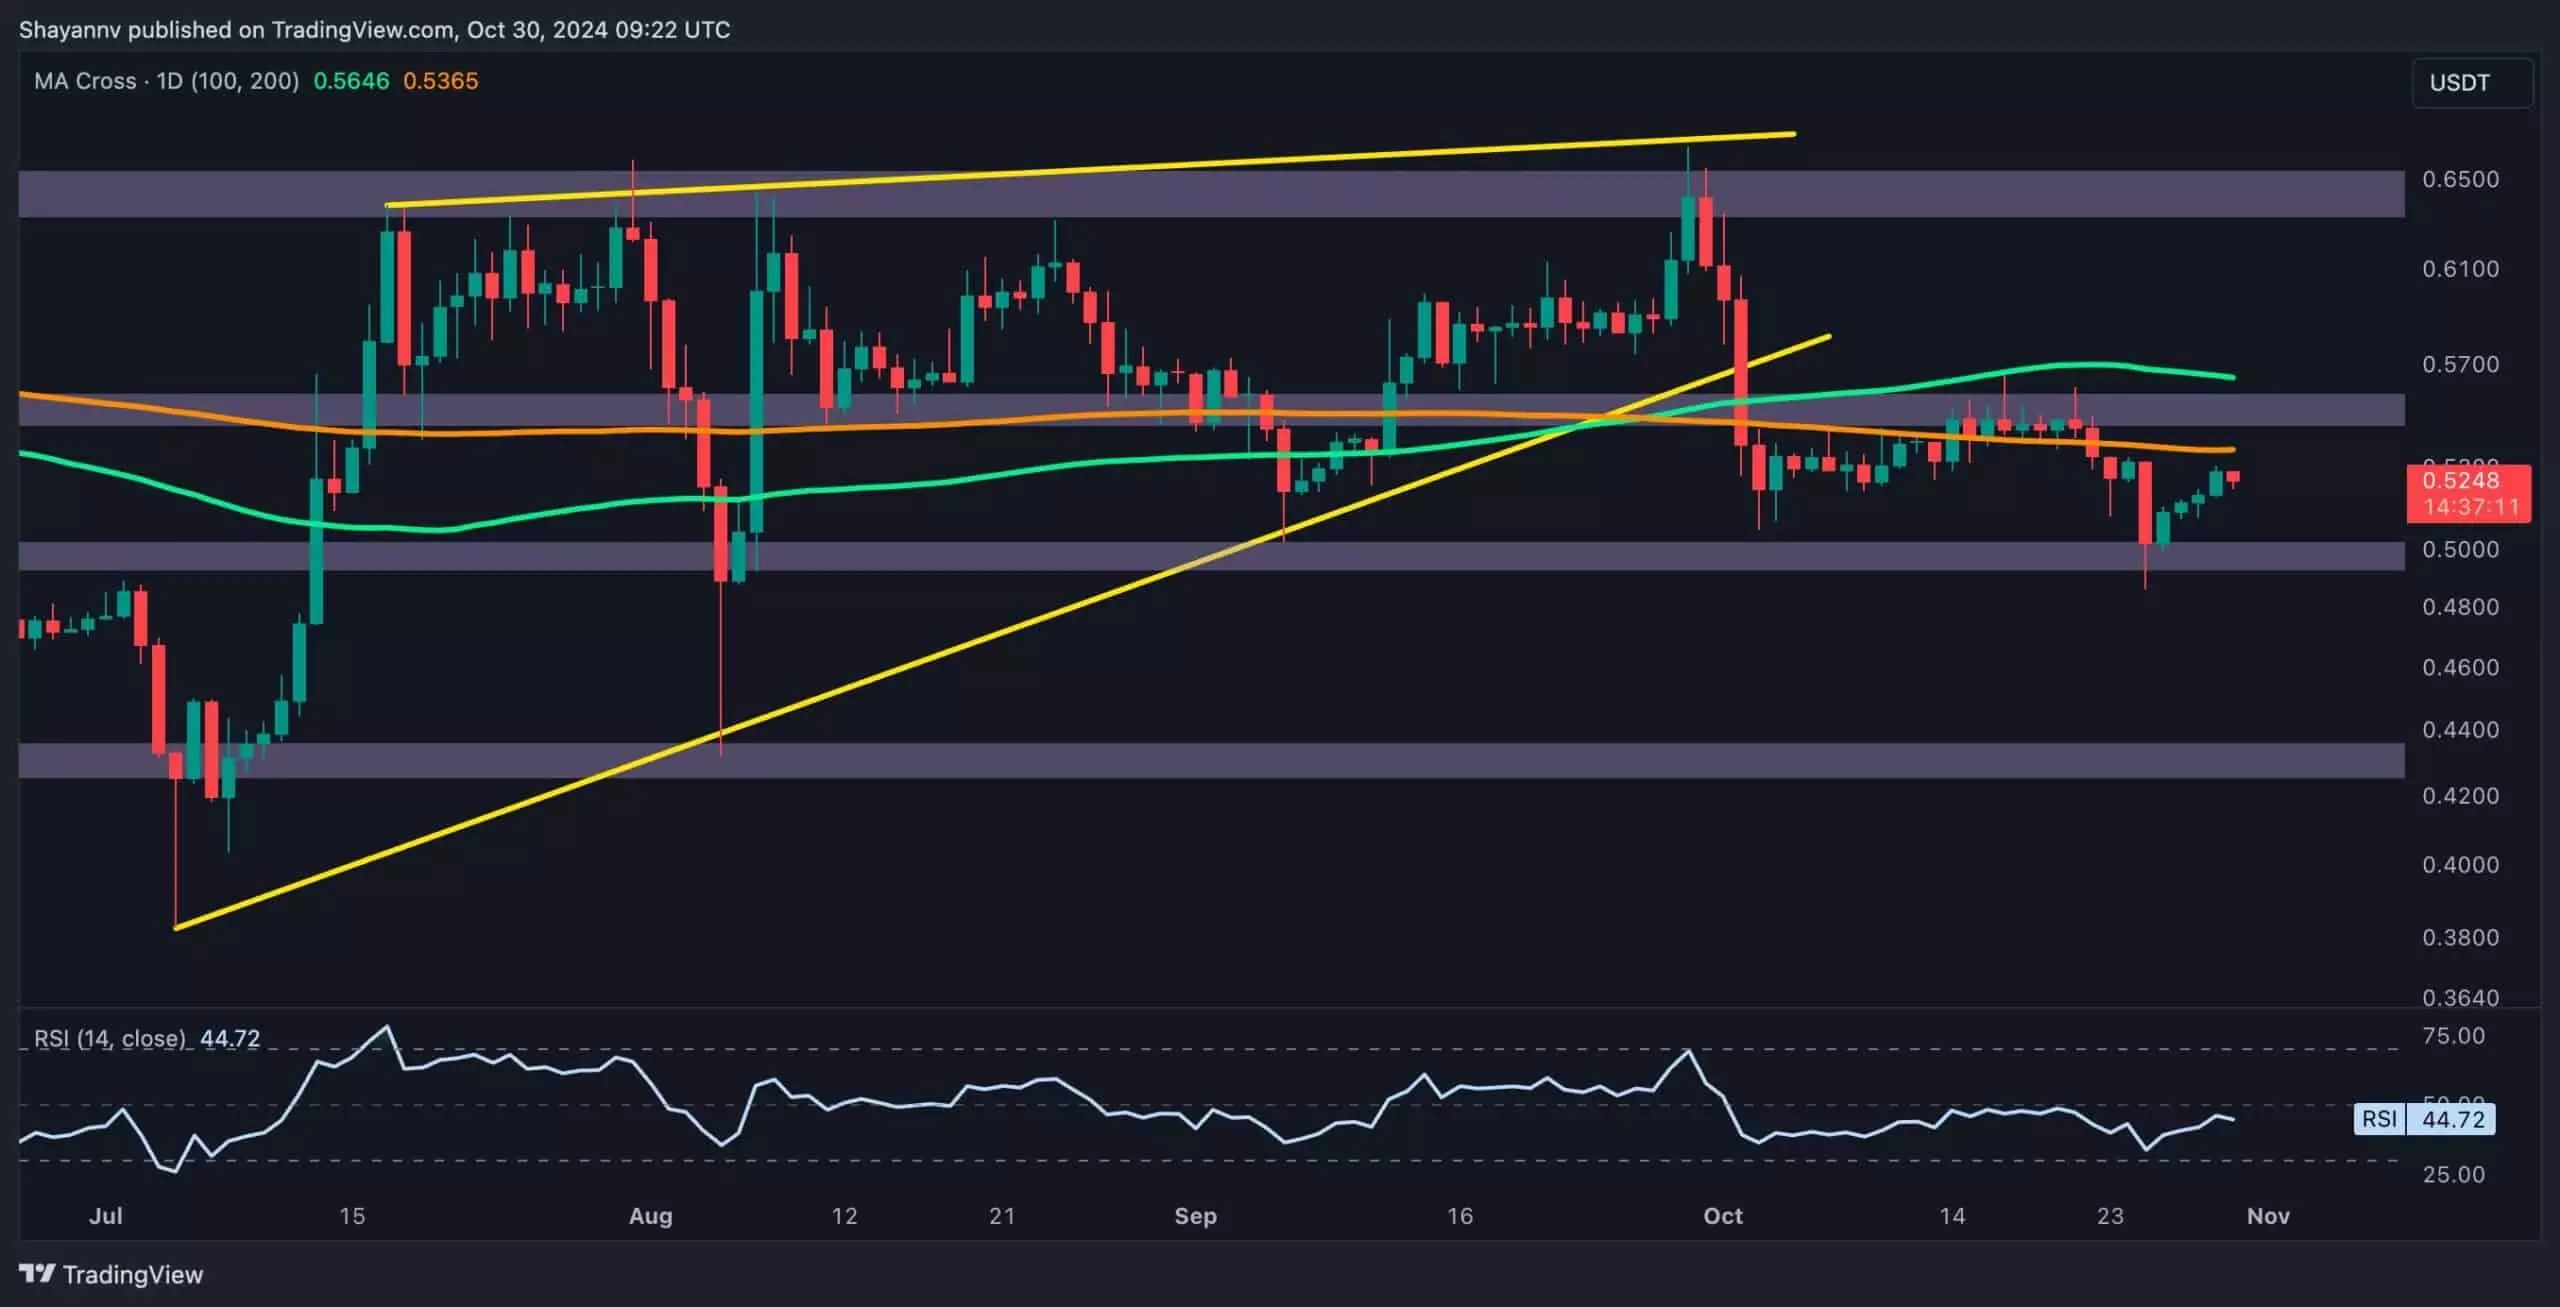
Ripple’s daily chart reveals a narrative dominated by resistance at the 200-day moving average (MA), which currently stands at $0.57. This critical threshold has been a fortress for sellers; after Bitcoin’s attempt to rally was thwarted at this level, selling pressure surged, pushing the price downward. The inability to maintain gains near this key resistance point suggests that market sentiment leans towards a bearish outlook. A definitive breakdown below the 200-day MA could catalyze further selling, potentially leading to price levels that have not been seen in some time.
Conversely, the $0.5 support level serves as a historical haven for buyers, acting as a psychological and tangible buffer against further declines. Over the past year, this threshold has consistently weathered selling storms, allowing holders to regroup. The current price dynamics indicate that Ripple has retraced back toward this critical support zone after encountering resistance at the 200-day MA. A subsequent rejection at this level would likely signal a completion of any brief bullish sentiment and could trigger cascading declines toward the potential target of $0.46, instilling further anxiety among investors.
Short-Term Indicators: A Closer Look at Patterns
Examining the 4-hour chart, we perceive a more granular view of market sentiment. Ripple trades within a narrow range characterized by the $0.5 (specifically $0.52) and $0.618 Fibonacci levels ($0.49). This has carved out a consolidation pattern marked by descending price action. Such patterns often precede significant movements; thus, traders are closely monitoring these thresholds for signs of a breakout or further rejection.
A recent formation of a descending wedge within this price range hints at potential bullish activity, especially as buying pressure has nudged Ripple’s price toward the upper boundary around $0.53. A breakout past this point could signal market optimism and may energize buyers to push for challenges against the next resistance at $0.55. However, given the overarching bearish sentiment emerging from broader market trends, the likelihood remains that a rejection at these upper levels could lead Ripple back to test the resilience of its $0.5 support, cementing a mid-term bearish outlook.
Ripple’s price action remains in a delicate balance between bearish pressures and minor bullish attempts. The crucial resistance posed by the 200-day MA and the significant support at the $0.5 level set the stage for potential conflict between buyers and sellers. Given the historical context and current patterns, traders should adopt a vigilant approach, ready to react swiftly to the unfolding market dynamics. The outlook remains uncertain, heavily influenced by intrinsic market behaviors and external factors that can ripple through the cryptocurrency landscape.


Leave a Reply