
Bitcoin has experienced a phase of price consolidation, hovering within a narrow trading range. After its significant drop from the psychologically pivotal $100,000 mark, the digital asset has shown indecisiveness. The lack of movement raises critical questions about market sentiment: are traders accumulating Bitcoin in anticipation of a future surge, or are they distributing holdings amidst growing uncertainty? This phase is crucial as it could indicate whether the cryptocurrency is primed for a rebound or poised for a more pronounced downturn.
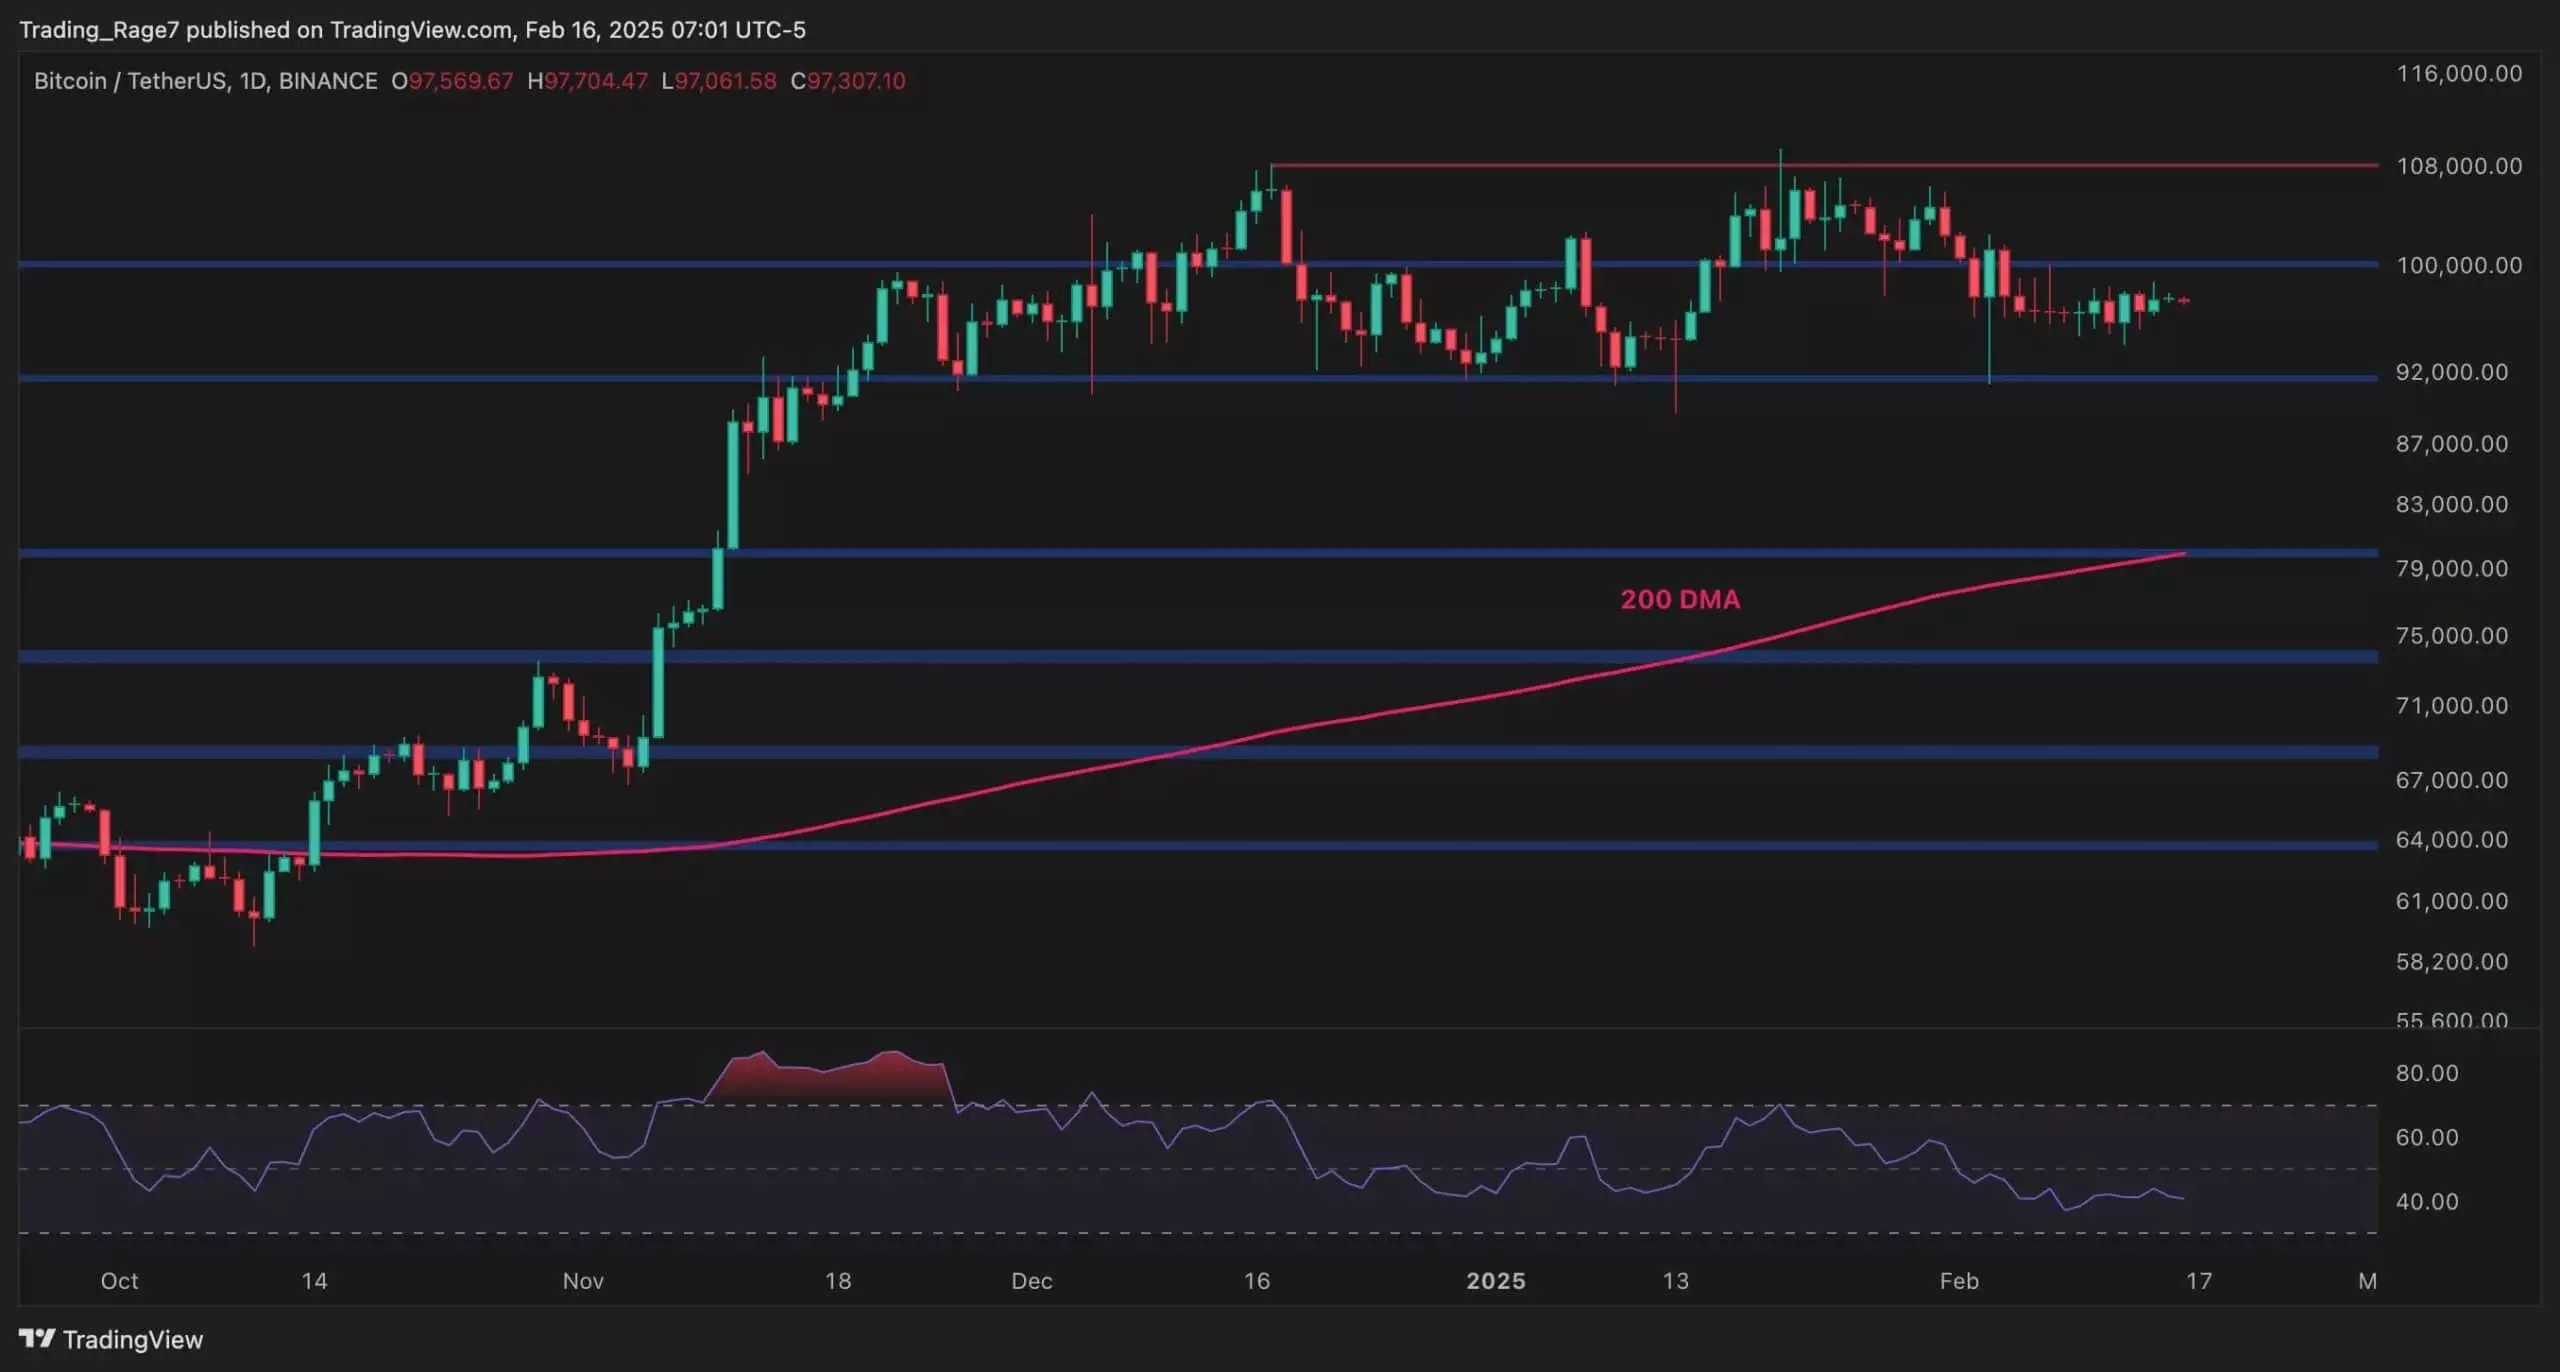
Despite the current bearish momentum, the price has found some support at the $92,000 level, while still holding above the essential 200-day moving average, which rests around $80,000. The relative strength index (RSI) is revealing a concerning trend, with values dipping below the neutral 50% mark, suggesting a deterioration of buying sentiment. This indicator’s persistently low values could foreshadow challenges in attempting to break out of the tightening price range and signify that a deeper correction could occur before any potential bullish momentum takes hold.
Diving deeper into the technical analysis, the 4-hour chart reveals the formation of a symmetrical triangle pattern. This type of pattern typically represents indecision in the market, as traders evaluate both bullish and bearish scenarios. Given the current momentum, there seems to be an inclination towards a downward breakout; the price has recently encountered resistance at the upper boundary of the triangle. Furthermore, the RSI has also fallen below 50%, adding to the bearish sentiment in the short term.
In the event of a breakdown from this symmetrical triangle, the next immediate target could be for Bitcoin to retrace to the $92,000 support level. A failure to hold this price could pave the way for a further decline towards the crucial $80,000 support zone. Such movement would further exacerbate bearish sentiment and could trigger additional sell-offs, as traders reassess their positions.
To gain a clearer picture of the market’s direction, analyzing accumulation and distribution trends is vital. A significant metric for this is the Bitcoin exchange reserve, which reflects the volume of Bitcoin held within exchange wallets. A rising reserve often signals increased supply, suggesting that holders are preparing to sell, thus heightening selling pressure.
Interestingly, recent data shows a marked decrease in exchange reserves, indicating a potential accumulation phase. However, the recent uptick in exchange reserves could reflect growing uncertainty among traders who may be hesitant to make substantial commitments amidst fluctuating market conditions. This could imply that traders are grappling with a lack of conviction regarding immediate price recovery, leaning instead towards a cautious approach as they evaluate market signals.
As the Bitcoin market navigates through these choppy waters, investors are advised to closely watch the ongoing price action and the RSI levels. Monitoring shifts in exchange reserves will also provide critical insights into market sentiment and potential future movements. While the paths for Bitcoin in the upcoming weeks remain uncertain, it is essential for both seasoned traders and new entrants to approach the market with a blend of caution and strategic analysis. Only with careful observation of these key indicators can one navigate the intricate dynamics of Bitcoin’s ever-evolving landscape.


Leave a Reply