
Ethereum’s price has recently settled into a critical trading zone between $3,500 and $4,000, demonstrating a notable tug-of-war between bullish and bearish sentiments. The current support near the lower end at $3,500 has emerged as a vital pillar for traders, underpinning a recovery attempt. This ongoing struggle not only delineates the boundaries of trading but also showcases the prevailing market dynamics at play. Following a dip below $4,000, the price showed resilience, with buyers reentering the market around the $3,500 level, signaling potential upward mobility.
As Ethereum has rallied back toward the $4,000 mark, this level has consistently manifested as a formidable barrier for bullish traders. History suggests that the $4,000 zone is marred by previous selling pressures, preventing any significant breakthroughs. The latest attempts to breach this threshold were met with strong rejections, resulting in a retreat that highlighted the unwavering presence of sellers at this level. This kind of market behavior indicates that $4,000 is not merely a price point, but a psychological barrier reflecting traders’ collective sentiment — a point at which many are inclined to secure profits or place shorts.
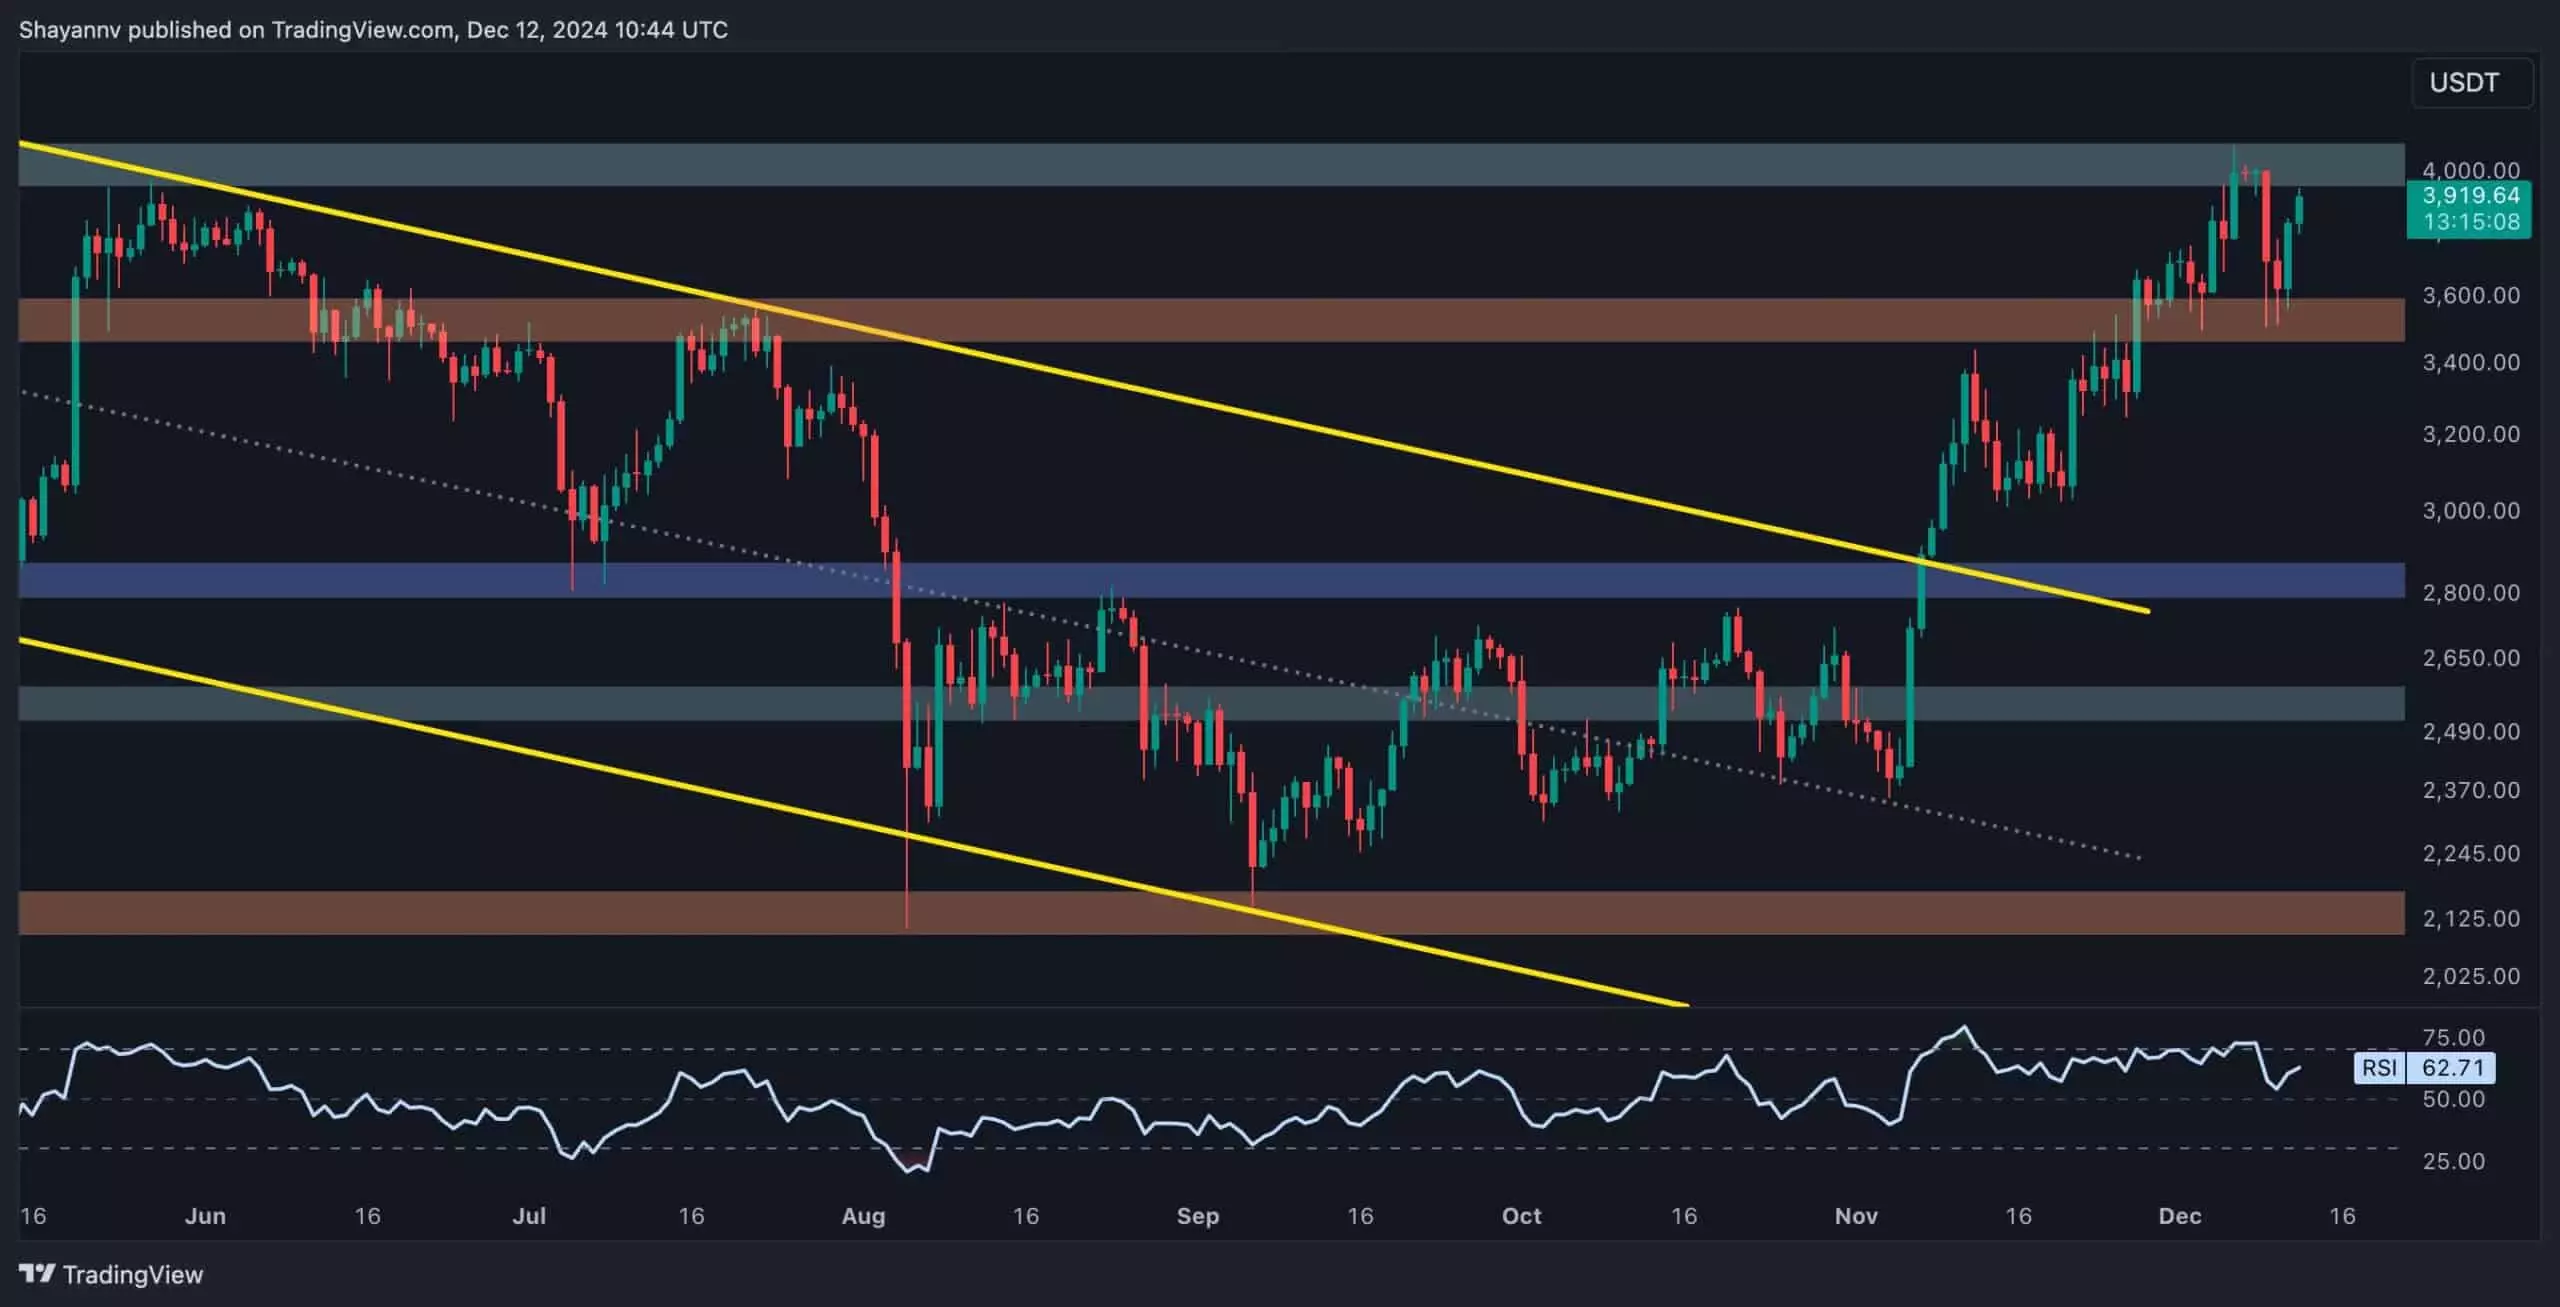
In the short term, the outlook for Ethereum appears to oscillate within this established range, characterized by periods of consolidation under the $4,000 threshold. Traders should exercise caution, particularly in light of bearish divergence signals on the RSI indicator, which often foreshadow potential price reversals. This divergence implies that while prices may attempt another push towards the resistance, the underlying momentum could be weakening, prompting traders to adjust their strategies. Positioning oneself strategically within these fluctuations can present opportunities, especially if the price hovers just beneath key resistance levels.
Liquidity plays a pivotal role in Ethereum’s trading dynamics, with significant zones identified at both the $3,500 support and the $4,000 resistance levels. The existence of a liquidity concentration near these points, particularly highlighted in tools like the Binance liquidation heatmap, can create opportunities for swift price movements. A decisive break above the $4,000 resistance could engender a cascade of short liquidations, leading to an explosive upward price movement. Such instances have the potential to galvanize bullish sentiment, as the actions of short-sellers covering their positions injects momentum into the market.
Given the interplay of support and resistance, Ethereum’s short-term trajectory remains uncertain. The current market conditions lean toward a bullish perspective, especially if buyers can maintain the pressure at $3,500 and successfully challenge the $4,000 resistance. However, traders should remain vigilant, as any adverse signals could prompt a quick pivot in sentiment. Ultimately, while a bullish breakout appears favorable based on recent buying behavior, the inherent volatility means that rapid shifts can occur, making it crucial for traders to stay informed and adaptive to the evolving market landscape.


Leave a Reply